Visualizing large workflows using D3, React and Clojurescript
In the previous part we focused on how titanoboa makes workflows more concise and less verbose, so as we can describe and visualize large workflows on an inherently limited space (being it a notepad, IDE, html canvas or one's FOV or short-term memory - does not matter, everything has limited space).
Another issue that arises when dealing with large workflows, is how to visualize them automatically. Sure, for each complex workflow you can have a person to manually position nodes and vertices for minutes or hours at a time so as the final positioning is the best arranged and least cluttered. But that clearly should be only an option if a user really wants to do it and also as a workflow is being developed - just by linking two steps that were not linked before - a beautiful and self-explanatory diagram can become utter mess.
So: how do you automatically visualize complex workflow the most clear and concise way possible?
We clearly need some heuristics so as the workflow graph nodes are positioned the best based on the number of adjacent nodes, vertices and overall structure of the graph.
D3 to the rescue

D3's Force module implements a velocity Verlet numerical integrator for simulating physical forces on particles. In the domain of information visualization, physical simulations are useful for studying networks and hierarchies.
This is exactly what we need! All-in-all, titanoboa's workflows are defined just as graphs.
Using Clojurescript and Reagent D3 the Immutable Way
D3 is great library, but it goes against React's principles of immutability. For titanoboa I use Reagent library for its UI development and I absolutely love it!
Reagent provides a way to write efficient React components using (almost) nothing but plain ClojureScript functions. It does not get into your way the way that some other (also great!) more opinionated Clojurescript libraries do.
So how do you add D3 into that mix? You can either let D3 do its thing and mutate your graph visualization independently - or you can try to take control and divide the responsibilities. I took the latter road and this is the gist of it:
- Let D3 mutate just the mathematical model of yur graph visualisation
- Upon every change of nodes/vertices positions let D3 mutate an atom with your graph nodes/vertices positions
- Use that atom as you would in any other Reagent application and visualize it as you see fit (titanoboa uses SVG and some cool icons to do that)
Following snippet outlines how the main part is being done in titanoboa:
(defn force-layout [graph-view-atom width height jobdef-name]
  (let [graph-cursor (cursor graph-view-atom [jobdef-name])
        fl (.. js/d3
               -layout
               force
               (charge -1000)
               (gravity 0.08)
               (linkDistance 135)
               (size (array width height))
               (nodes (clj->js (:nodes @graph-cursor)))
               (links (clj->js (:vertices @graph-cursor)))
               start)]
    (.on fl "tick" (fn [e] (let [k (* 6 (.-alpha e))
                                 links (. fl links)
                                 _ (doall (for [d links]
                                            (do (set! (-> d .-source .-y) (- (.. d -source -y) k))
                                                (set! (-> d .-target .-y) (+ (.. d -target -y) k)))))
                                 repositioned-nodes (walk/keywordize-keys (js->clj (.nodes fl)))]
                             (swap! graph-cursor merge {:nodes
                                                        (mapv #(update-vals % [:x :y :px :py] Math/round) repositioned-nodes)}))))
    fl))
The Result:
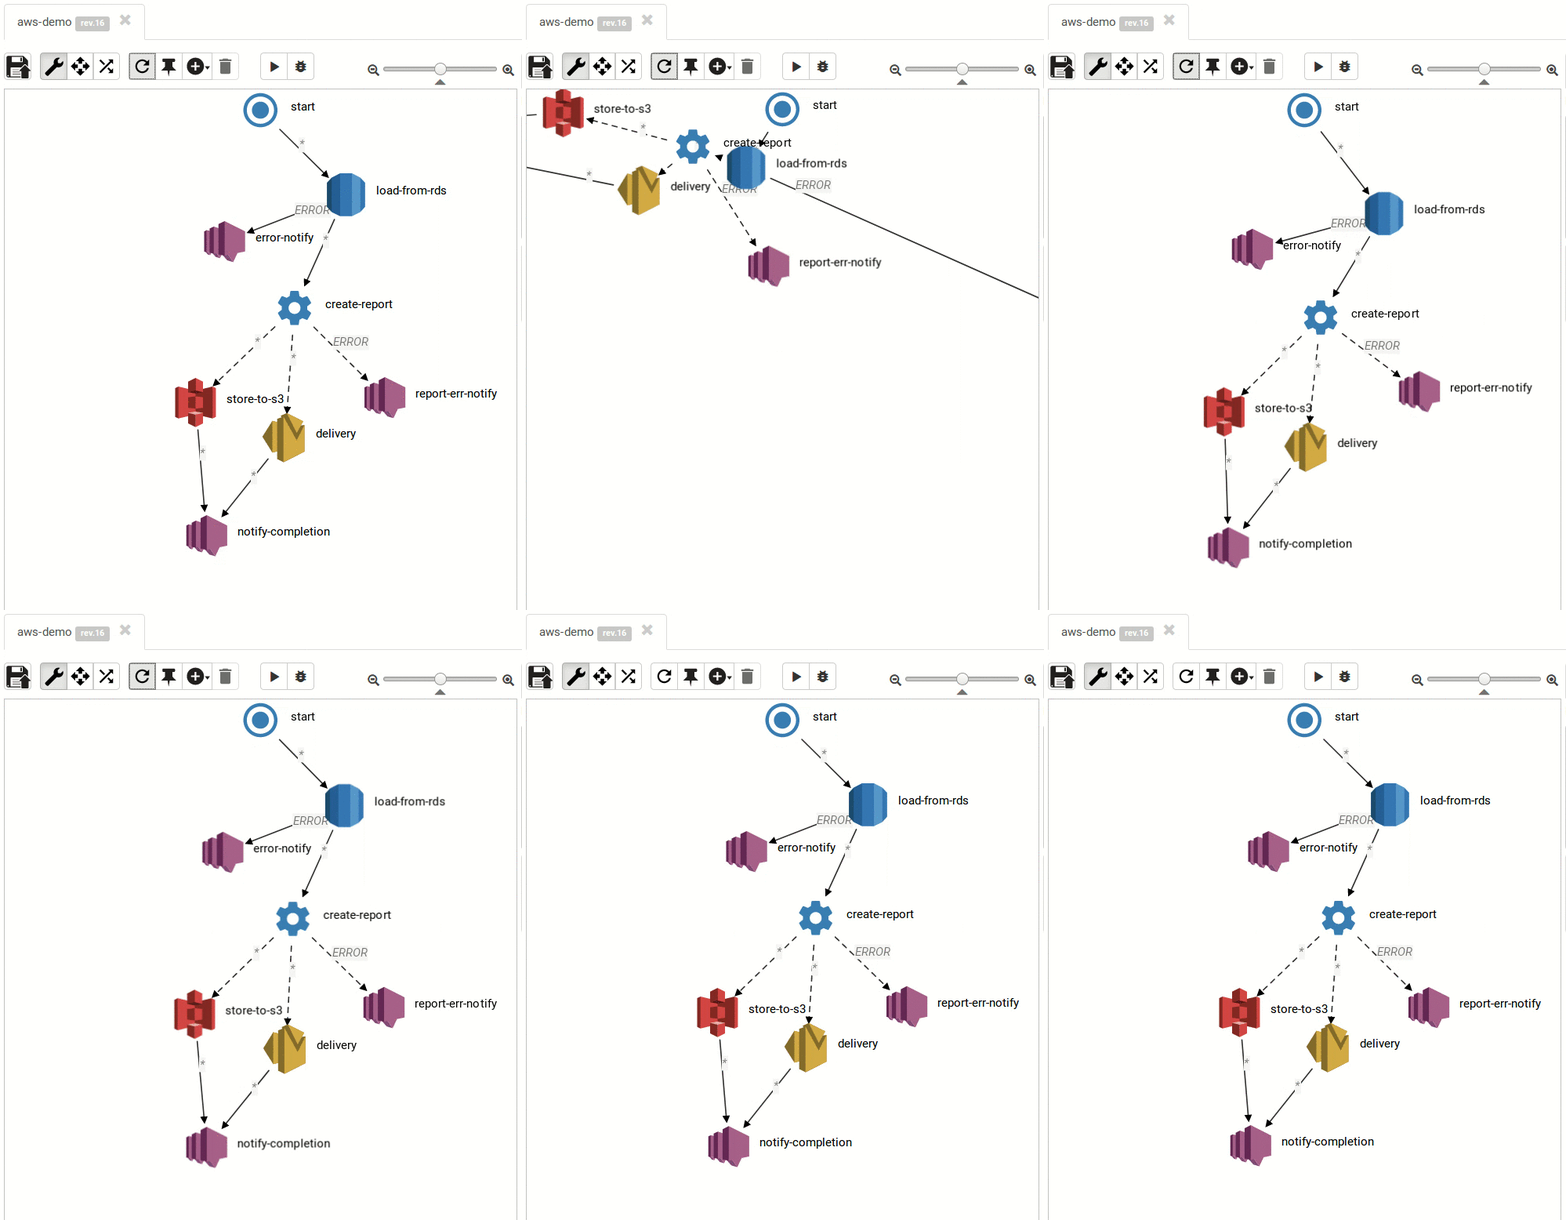
Small and medium workflows look cool:

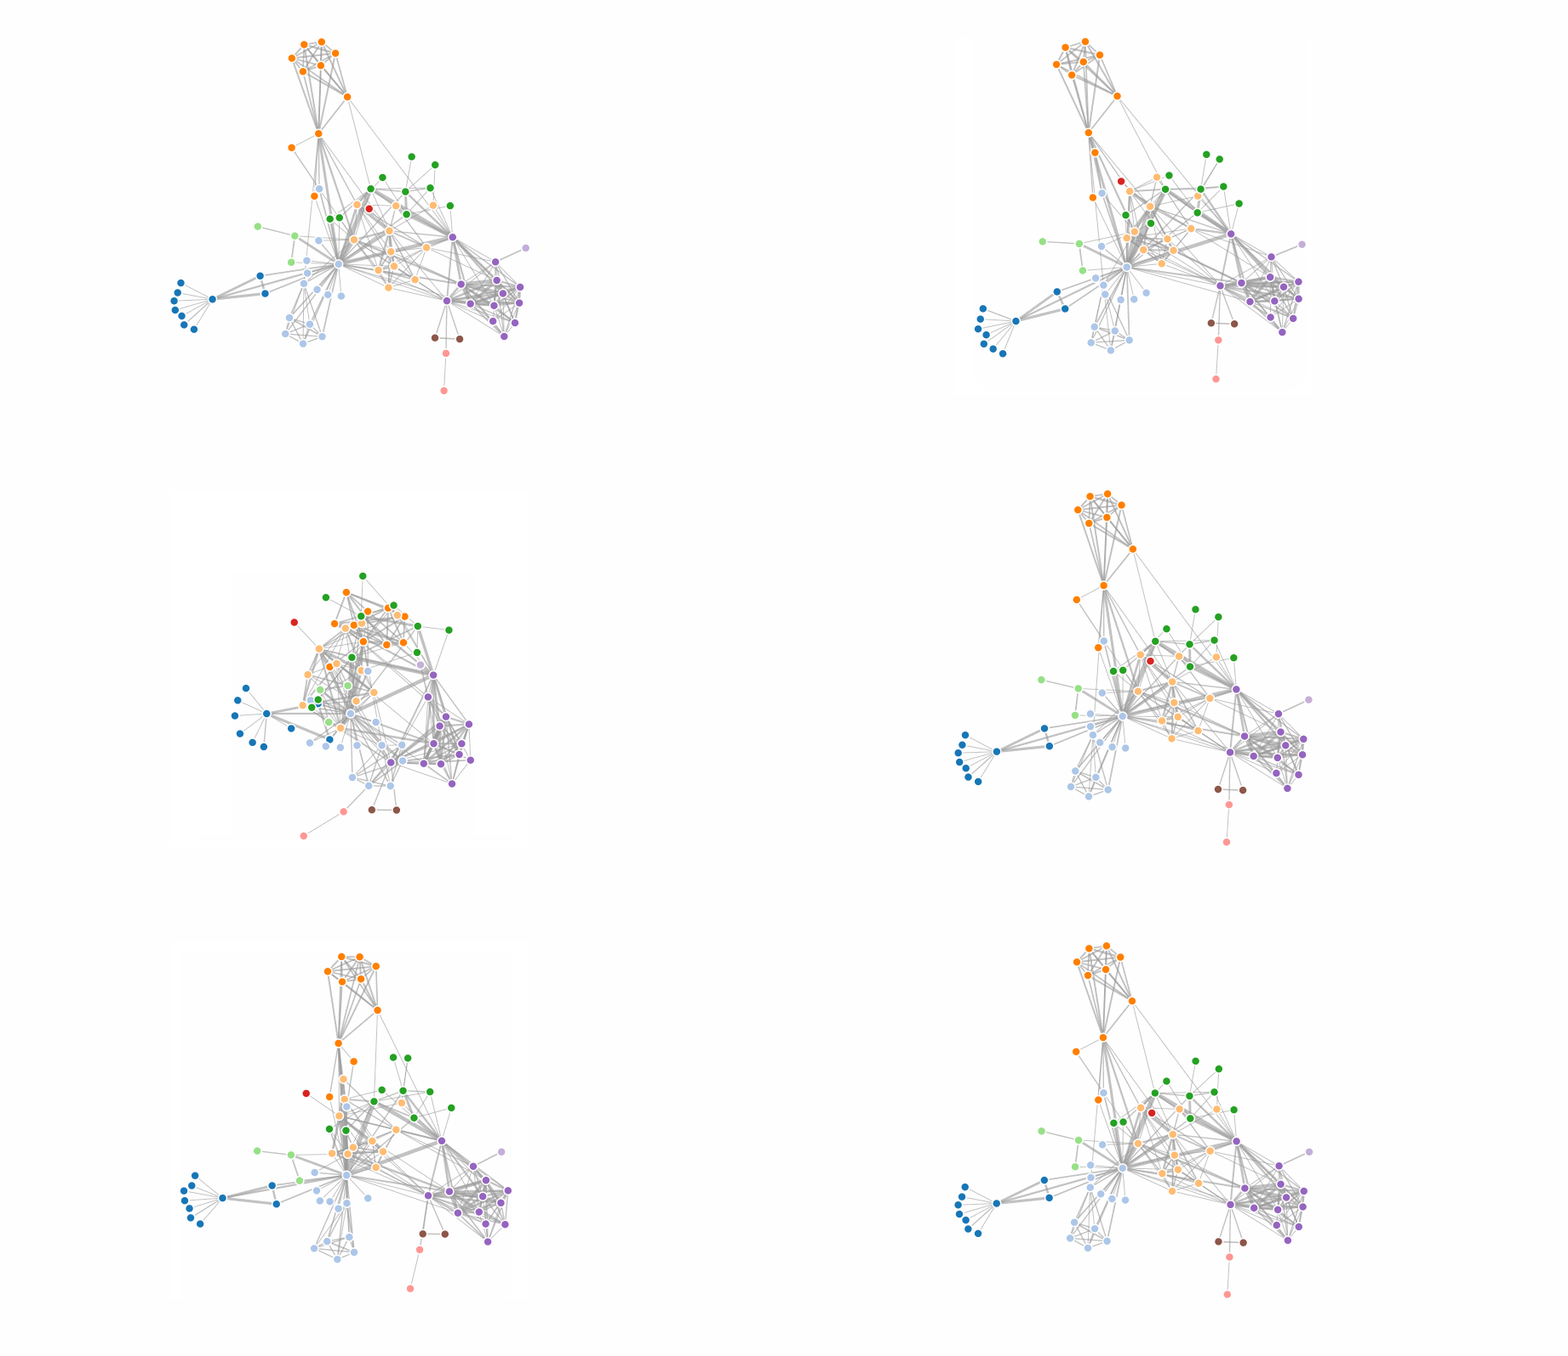
... and so do the large ones:

Read more about titanoboa in our github wiki.